Key Takeaways
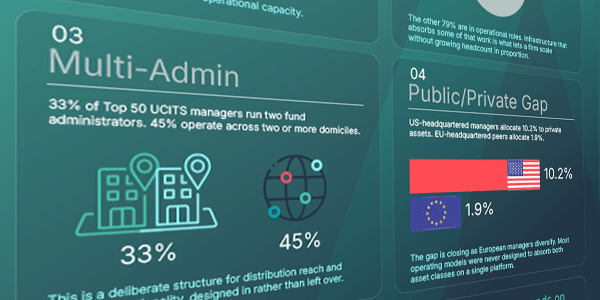
- US-headquartered asset managers allocate 10.2% to private assets on average. EU-headquartered peers allocate 1.9%.
- Most firms running multi-asset mandates today operate public assets in one accounting system and private assets in another, with the operations team holding the two views together by hand.
- Parallel systems generate five compounding costs: reconciliation labor, reporting lag, error risk, audit overhead and a structural ceiling on growth.
- A unified accounting engine treats public, private and digital assets as projections of a single dataset rather than aggregating outputs from separate systems.
- Private credit is the asset class most likely to expose the limits of a public-markets-first platform, because the events, lifecycle and documentation requirements don’t map onto share-class accounting.
US-headquartered asset managers in the 2026 Funds Europe Top 200 survey allocate 10.2% to private assets on average. EU-headquartered peers allocate 1.9%. Non-EU European peers allocate 1.3%. The 8-percentage-point gap between US and European private allocations is closing fast as European managers diversify, but the operating models that have to absorb that shift were largely built for a public-markets-only world.
Most firms running multi-asset mandates today operate public assets in one accounting system and private assets in another, with the operations team holding the two views together by hand. That model worked when private allocations were a rounding error, but it does not work as those allocations grow.
This piece argues three things: convergence is occurring, the Funds Europe data points to it directly and the operating models most firms run today were never designed to absorb it.
The Convergence Reality
The Funds Europe survey captured the European version of a story that has been building for a decade; private assets are an expanding part of multi-asset mandates, with the structural growth concentrated in private credit, real estate, infrastructure and private equity.
Looking at the survey data:
- US HQ managers allocate 10.2% to private assets, 2.5% to real estate
- EU HQ managers allocate 1.9% to private assets, 3.9% to real estate
- Non-EU European HQ managers allocate 1.3% to private assets, 6.5% to real estate
The gap between US and European private allocations is the closing edge of a structural shift. European managers are not going to stay at 1.9% indefinitely. Being positioned to close that gap without slowing the rest of your business down means leveraging accounting infrastructure that was built for both public and private from the start.
Why Parallel Systems Break as You Scale
Public and private assets have historically been managed on separate technology because they behave differently. Public assets trade daily, mark-to-market against observable prices and settle on standard cycles. Private assets follow lifecycle events, value quarterly or annually and require accounting for capital calls, distributions and waterfall structures that public market platforms were not designed to handle.
So most firms end up with the same structural setup:
- A primary accounting platform for listed securities
- A separate system, often a lightly modified public market platform or a stack of spreadsheets, for private equity, private credit, real estate and infrastructure
- A reporting layer that pulls from both and a team whose job is making the numbers reconcile
The cost of this model shows up in five places.
- Reconciliation labor: scales linearly with every new private mandate, because every position has to match across two systems that were not designed to communicate.
- Reporting lag: consolidated views require manual aggregation across systems, which means investors and boards see a stale picture.
- Error risk: every manual touch between platforms introduces typos, missed corporate actions and timing mismatches between public marks and private valuations.
- Audit overhead: two systems means two audit trails, two control frameworks and two sets of evidence to produce when the regulator or the auditor asks.
- A structural ceiling on growth: every new mandate that mixes public and private adds disproportionate operational load. Growth means headcount.
The Funds Europe data makes the structural ceiling concrete. Across the Top 50, fewer than 21% of employees are investment professionals. Adding private allocations on top of parallel infrastructure means hiring proportionally more of those operational employees, which moves in the opposite direction the data shows leading firms are heading.
What Unified Accounting Truly Looks Like
A unified accounting engine treats public, private and digital assets as projections of a single underlying dataset, computed continuously from one ledger rather than aggregated from separate systems.
In practice, this means:
- One accounting engine processing equities, fixed income, derivatives, digital assets, private credit, private equity, real estate and infrastructure within a single system of record while supporting the unique lifecycle requirements of each asset class.
- Multi-book architecture generates GAAP, Tax and Performance views simultaneously from one set of events, with no reprocessing between books.
- Fund hierarchies including master-feeder, fund-of-funds, rollup groups and pooling arrangements supported natively.
- AI-native document intelligence parses loan agreements, capital call notices and LP statements directly into the system of record, substantially reducing manual data entry.
- Exception-based workflows flagging anomalies in facility notices and capital flows before they reach NAV.
The result is one set of books for a fund holding listed equity, derivatives, private credit and real assets computed from one accounting engine rather than assembled from multiple systems and subledgers.
This architectural shift matters more than any individual capability. When public and private run through the same engine, the operating model stops being a reconciliation problem and starts being a single source of truth.
The Structural Complexity of Private Credit
Private credit deserves a closer look because it is the asset class most likely to expose the limits of a public-markets-first accounting platform.
Private credit accounting is a different problem from public market accounting in almost every dimension that matters. You’re tracking facilities through their full lifecycle, which means drawdowns, repayments, rollovers and commitment changes that arrive on bespoke schedules rather than market calendars. Interest accrues continuously across both funded and unfunded positions. Agent bank details, contract security masters, amendment notices, waiver letters, all of which arrive as PDFs and have to be interpreted before they go anywhere near the books.
Public market platforms can be configured to handle some of this, but they can’t handle it well. The events don’t map onto share-class accounting, the lifecycle doesn’t match a daily NAV cycle and the documentation can’t be processed at scale without AI-native document intelligence built into the platform, which most legacy systems lack.
This is why firms consolidating off point solutions for private credit typically find that the consolidation problem is bigger than the original tool.
Building for the Convergence
The Funds Europe data captures a market in transition, with US managers already operating at substantial private allocations and European managers catching up. Scaling through that transition depends on accounting infrastructure built for it from the start.
For asset managers and wealth managers expanding into alternatives, the consolidation question has shifted from whether to when, and onto what. Building for the convergence now sets up a stronger operational position as private allocations grow into a larger share of multi-asset mandates.
Read the full Funds Europe Top 200 report.